Melody
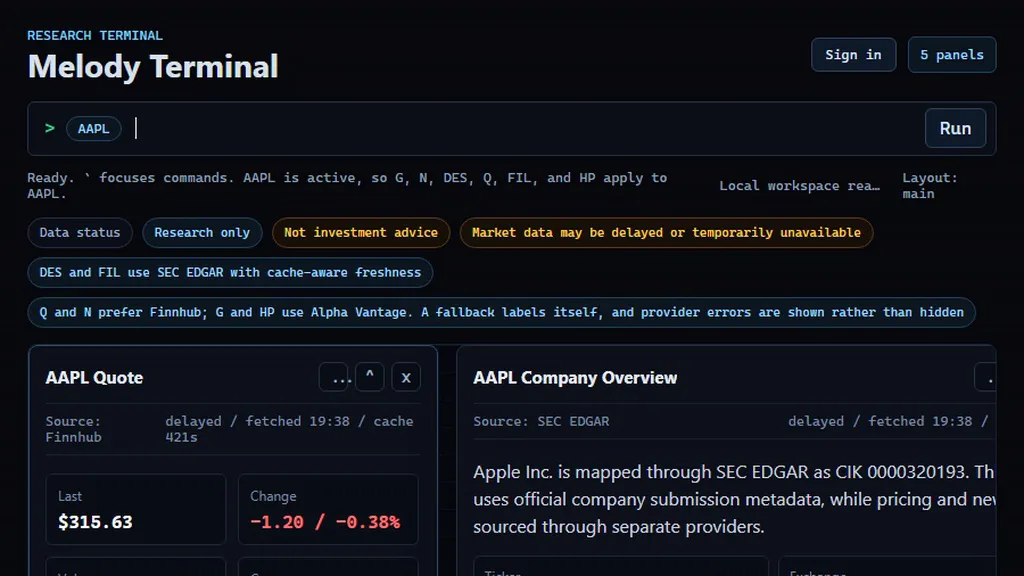
A command-first research terminal for public companies.
- Year
- 2026
- Role
- Design and engineering
- Stack
- TypeScript · SEC EDGAR · Node · Playwright
The problem
The same question as Proof-Lens, pointed at a different record: a filing is only worth reading if you can see where it came from and how old it is. Most tools show you the number and hide both.
Research tools for public companies are built around dashboards. Dashboards are good at showing you what someone else decided was important, and bad at answering a specific question quickly. If you already know what you want, a dashboard is in your way.
The approach
Melody inverts it. You type what you want and the answer streams back.
- Primary sources. SEC filings direct from EDGAR, not a summarised feed.
- Delayed market data, clearly labelled as delayed. The honest presentation matters more than the freshness.
- Command-first. Keyboard is the primary interface; the UI exists to display results, not to be navigated.
What was hard
Filing data is messy in ways that resist generic parsing: the same concept is tagged differently across filers and across years. Most of the work is in the normalisation layer that sits between EDGAR and anything a user sees.
What I'd change
The rate limiter and the cache are process-local, and that is the thing that
breaks under success. The limiter defaults to an in-process store, and the
provider cache falls back to a module-scope Map when Supabase is not
configured. At one instance this is fine. At two, each replica keeps its own
counters, so "120 requests per five minutes" silently becomes 120 per replica
with no coordination, and no test would catch it, because the whole suite runs
in a single process.
Moving both onto shared state is the single highest-leverage change rather than the easy one: every other weakness here is static, and this is the only one that gets worse precisely as the product succeeds.
The XBRL normalisation drops metrics silently, which is a gap against the
product's own premise. It walks a preference-ordered list of concepts per
metric, because companies tag the same line item differently: Apple files
revenue under one concept where others use plain Revenues. If every candidate
misses, that metric is simply omitted from the response; only when all five fail
does it raise anything. A foreign private issuer filing 20-F instead of 10-K
gets a financials panel that looks complete and is not, with nothing saying so.
For a tool whose entire pitch is never hiding where a number came from, that is
the wrong failure mode.
One thing I got wrong and fixed. The provider chain falls back per capability, not per provider: one source structurally declines historical bars, which is a "will not" rather than a "cannot". The first version marked every bars response degraded, so every chart carried the badge, which teaches people to ignore it on the one occasion it means something.
What I would reverse is shipping nine roadmap-shell commands: placeholder panels that opened and explained why they did not work yet. It felt honest, and it meant the help catalogue spent most of the project advertising features that did not exist, five of them blocked on paid data from the first day. They are retired now, replaced by a Planned section naming what each is actually waiting on. On a project whose whole pitch is not pretending, that is the one place where shipping something beat shipping nothing, and should not have.